This article will show you an example of how to display Math Text, Grid in the Matplotlib plot. It will also show you how to adjust the axis number values range with examples.
1. How To Show Math Text.
- You can use the matplotlib.pyplot module’s text() method to plot math text on the Matplotlib plot.
- But you should add the character r before the math text string to tell the text() method that the input text string is raw math text.
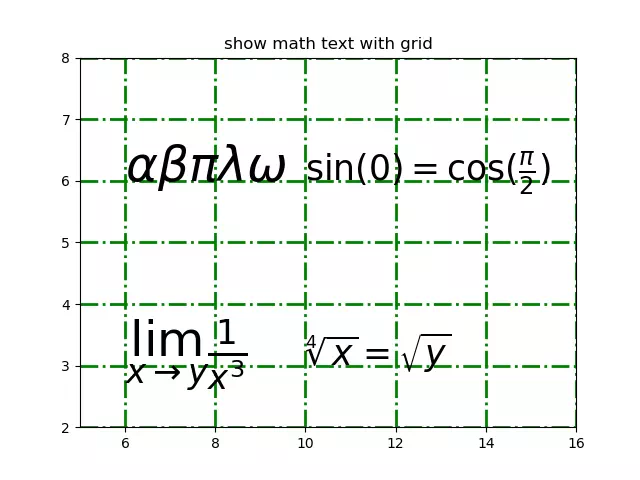
plt.text(6,6,r'$ \alpha \beta \pi \lambda \omega $',size=35)
2. How To Show Grid.
- The matplotlib.pyplot module’s grid() method can be used to display the grid in the Matplotlib plot.
- You can specify the grid color, line width & style as below example.
plt.grid(color='g',linewidth='2',linestyle='-.')
- The above code will draw a green color grid, the line width is 2 pixels, and the line style is ‘-.’.
3. How To Adjust Axis Number Values Range
- The matplotlib.pyplot module’s xlim() & ylim() methods are used to adjust the axis number values range.
- Below is the example, it will adjust the x-axis number values starting with 5 and ending with 16.
plt.xlim([5, 16])
4. How To Show Math Text, Grid On Matplotlib Plot, And Adjust Axis Number Values Range Example.
- The below example shows you how to display math text, the grid on Matplotlib plot.
- It will also show you how to adjust the axis number values range.
- Below is the example source code.
import numpy as np import matplotlib.pyplot as plt def plot_with_mathtext_and_grid(): # set the plot title. plt.title('show math text with grid') # set the grid color, width and line style. plt.grid(color='g',linewidth='2',linestyle='-.') # adjust the x axis number range. plt.xlim([5, 16]) # adjust the y axis number range. plt.ylim([2, 8]) # show the raw math text in the specified point with the specified size. plt.text(6,6,r'$ \alpha \beta \pi \lambda \omega $',size=35) plt.text(10,3,r'$ \sqrt[4]{x}=\sqrt{y} $',size=25) plt.text(6,3,r'$ \lim_{x \rightarrow y} \frac{1}{x^3} $',size=35) plt.text(10,6,r'$ \sin(0)=\cos(\frac{\pi}{2}) $',size=25) plt.show() if __name__ == '__main__': plot_with_mathtext_and_grid() - When you run the above example source code, you will get the below picture.