This example will tell you how to use the matplotlib.patches module to draw filled shapes. It will draw 4 shapes, a green rectangle, a blue circle, a red ellipse, and a blue polygon.
1. How To Use Matplotlib.patches Module To Draw Filled Shape.
- You should import the matplotlib.patches module.
- Then you can use it’s below methods to create related shape with filled colors.
- Rectangle(xy, width, height, angle=0.0, **kwargs): create a rectangle with filled color.
- Circle(xy, radius=5, **kwargs): create a circle with filled color.
- Ellipse(xy, width, height, angle=0, **kwargs): create a ellipse with filled color.
- RegularPolygon(xy, numVertices, radius=5, orientation=0, **kwargs): create a regular polygon with filled color.
2. Matplotlib Patches Example.
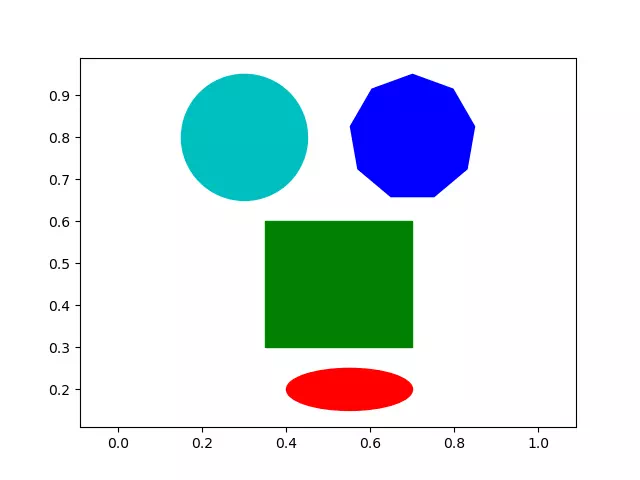
- The below example will create 4 shapes with filled colors, a green rectangle, a cyan circle, a red ellipse, and a blue polygon.
- Below is the example source code.
import numpy as np import matplotlib.patches as patches import matplotlib.pyplot as plt def matplotlib_patches_example(): # get sub plots of the current canvas. fig,ax=plt.subplots() # draw a green rectangle # create the rectangle anchor point ( the bottom left point ) coordinates in an array. rectangle_anchor_point_coordinates_array = np.array([0.35,0.3]) # create the rectangle width, height, and fill color variable. rectangle_width = 0.35 rectangle_height = 0.3 rectangle_fill_color = 'g' # invoke the matplotlib.patches's Rectangle() method to create the rectangle object with the provided parameters. rect = patches.Rectangle(rectangle_anchor_point_coordinates_array, rectangle_width, rectangle_height,color = rectangle_fill_color) # add the rectangle object to the axes. ax.add_patch(rect) # draw a circle. circle_center_point_coordinates_array_= np.array([0.3,0.8]) circle_radius = 0.15 circle_fill_color = 'c' circle = patches.Circle(circle_center_point_coordinates_array_, circle_radius, color = circle_fill_color) ax.add_patch(circle) # draw a red ellipse. ellipse_center_point_coordinates_array = np.array([0.55,0.2]) ellipse_major_axis_radius = 0.3 ellipse_minor_axis_radius = 0.1 ellipse_fill_color = 'r' ellipse = patches.Ellipse(ellipse_center_point_coordinates_array, ellipse_major_axis_radius, ellipse_minor_axis_radius,color = ellipse_fill_color) ax.add_patch(ellipse) # draw a polygon. polygon_center_point_coordinates_array = np.array([0.7,0.8]) polygon_border_number = 9 polygon_radiu = 0.15 polygon_fill_color = 'b' polygon = patches.RegularPolygon(polygon_center_point_coordinates_array, polygon_border_number , polygon_radiu, color = polygon_fill_color) ax.add_patch(polygon) # make the x & y axis equal. ax.axis('equal') plt.show() if __name__ == '__main__': matplotlib_patches_example() - When you run the above example, you will get the below figure.