This article will tell you how to use the Matplotlib fill() method to fill the Matplotlib curve colors and how to use the fill_between() method to fill the colors between 2 Matplotlib curves.
1. Matplotlib fill() Method Example.
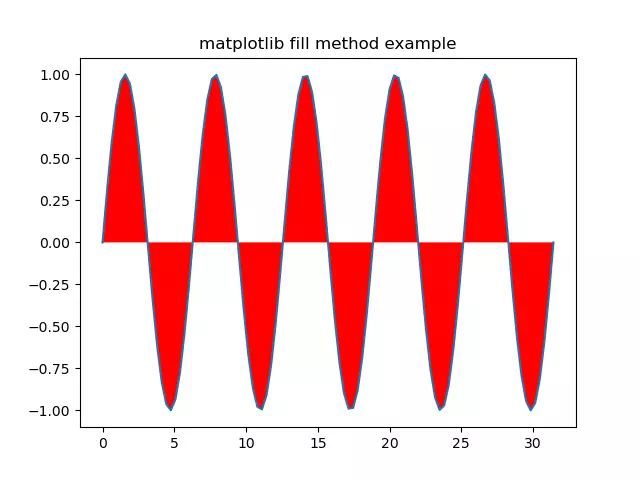
- The fill(x, y, color) method needs at least 3 parameters to fill the curve color.
- x: the x-axis values array.
- y: the y-axis values array.
- color: the curve-filled color string such as ‘r’ means red color.
- You can refer to the matplotlib.pyplot.fill to get the complete parameters list.
- Below is the example source code.
import numpy as np import matplotlib.pyplot as plt def fill_example(): # set the curve title. plt.title('matplotlib fill method example') # create an array, starts with 0, ends with 10*np.pi, create 1000 elements in the array. x_array = np.linspace(0, 10*np.pi, 100) print('x_array: ', x_array) print('len(x_array): ', len(x_array)) # calculate the y array values. y_array = np.sin(x_array) print('y_array: ', y_array) # plot the curve. plt.plot(x_array, y_array) # fill the curve with red color. plt.fill(x_array, y_array, 'r') plt.show() if __name__ == '__main__': fill_example() - Below is the above source code generated figure.
2. Matplotlib fill_between() Method Example.
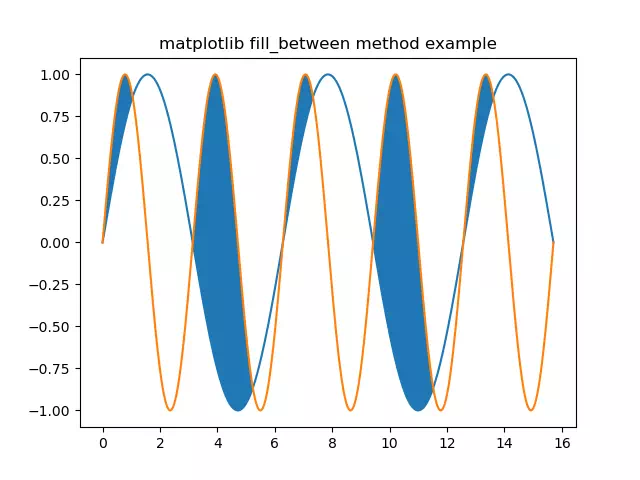
- The fill_between(x, y1, y2, where, interpolate, step) method needs at least 6 parameters to fill color between 2 Matplotlib curves.
- x: the x-axis values array.
- y1: the first curve’s y-axis values array.
- y2: the second curve’s y-axis values array.
- where: the filled area that matches this condition.
- You can get the complete parameter introduction from the matplotlib.pyplot.fill_between official document.
- Below is the example source code.
import numpy as np import matplotlib.pyplot as plt def fill_between_example(): # set the curve title. plt.title('matplotlib fill_between method example') # create x axis value array, starts from 0, ends with 5*np.pi, total generate 1000 array elements. x_array = np.linspace(0,5*np.pi,1000) # calculate the first y axis value array. y_array1 = np.sin(x_array) # calculate the second y axis value array. y_array2 = np.sin(2 * x_array) # plot the first curve. plt.plot(x_array, y_array1) # plot the second curve. plt.plot(x_array, y_array2) # fill the color between the area where y_array1's value less than y_array2's value. plt.fill_between(x_array, y_array1, y_array2, where=y_array1<y_array2, interpolate=True) plt.show() if __name__ == '__main__': fill_between_example() - When you run the above example source code, it will show the below figure.