This article will show you how to use matplotlib to draw single-line plot graphs in Python and iPython.
1. Check Matplotlib Has Been Installed Correctly.
- Before coding, we should confirm that the matplotlib library has been installed correctly.
- Open a terminal and run
pip show matplotlibcommand, if you find the below output message, then it means the matplotlib python package has been installed successfully.$ pip show matplotlib Name: matplotlib Version: 3.0.2 Summary: Python plotting package Home-page: http://matplotlib.org Author: John D. Hunter, Michael Droettboom Author-email: [email protected] License: BSD Location: /home/zhaosong/anaconda3/lib/python3.7/site-packages Requires: numpy, cycler, kiwisolver, pyparsing, python-dateutil Required-by: seaborn, scikit-image
- If you find matplotlib has not been installed, you can read the article How To Install Anaconda On Linux, Windows, macOS Correctly to install anaconda in your operation system, because anaconda has installed all matplotlib dependent libraries, so after you install anaconda, matplotlib should be installed also.
2. Use Matplotlib To Draw Single Line Chart In Python Command.
- Open a terminal and run the command
pythonto go to the python interactive console.$ python Python 3.7.1 (default, Dec 14 2018, 19:28:38) [GCC 7.3.0] :: Anaconda, Inc. on linux Type "help", "copyright", "credits" or "license" for more information.
- Import
matplotlib.pyplotmodule, and alias the module with name plt.>>> import matplotlib.pyplot as plt
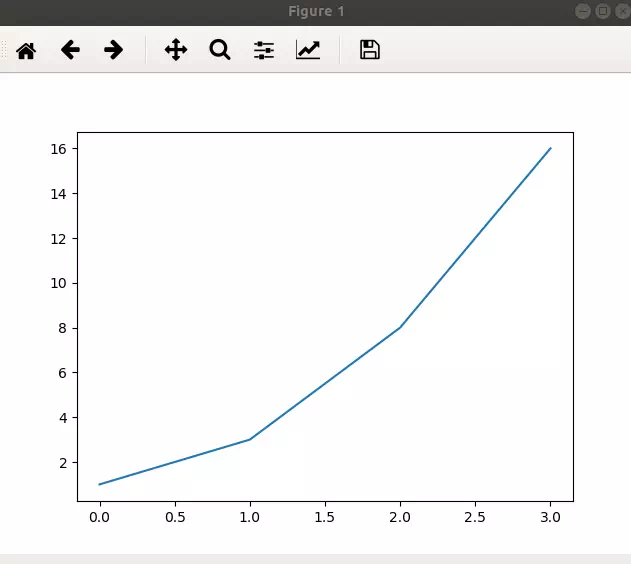
- Draw a single line chart use the pyplot.plot function. Please note the plot function’s first parameter is a number list that represents the vertical axis ( y-axis ).
>>> plt.plot([1,3,8,16])
[<matplotlib.lines.Line2D object at 0x7fb381109748>]
- Display the chart image with
plt.show()command.>>> plt.show()
- Then you will see a dialog popup with the one-line chart displayed. You can see there are four points that have been connected with a straight line.
- If you want to save the above picture to a local png file, you can run the below method to replace
plt.show(). Then you can exist python interactive environment and find the test.png file in the current directory.>>> plt.savefig('test.png') >>> exit() $ ls -l
3. Use Matplotlib To Draw Single Line Plot In iPython.
- Startup the jupyter notebook web server by executing the command
$ jupyter notebookin a terminal. - If the above command show any errors, please read the article How To Use IPython Jupyter Notebook To Develop Python Code.
- Then a web browser will open and direct you to the jupyter notebook web GUI page.
- Create a new .ipynb file by click New —> Python 3 menu item.
- Input below python code in the first line cell, and click the Run button, then you will see the generated image test1.png below it.
import matplotlib.pyplot as plt
plt.plot([1,3,8,16])

plt.savefig('test1.png')