Python matplotlib module is used to draw graphical charts. This article will tell you how to use matplotlib to draw points and lines. But before you can use it, you should make sure it is installed. You can follow the below steps to check, if there is no error message printed out, then it means the matplotlib module is installed.
1. Verify matplotlib Has Been Installed.
- Open a terminal, and run the command python to go to the python interpreter console.
- Run the command import matplotlib in the python interpreter console.
- If you get the below message, it means the matplotlib module has been installed correctly.
192:$ python
Python 3.6.5 |Anaconda, Inc.| (default, Apr 26 2018, 08:42:37)
[GCC 4.2.1 Compatible Clang 4.0.1 (tags/RELEASE_401/final)] on darwin
Type "help", "copyright", "credits" or "license" for more information.
>>> import matplotlib
>>>
- If it prompts ModuleNotFoundError: No module named ‘matplotlib’ error message, it means the matplotlib module has not been installed.
>>> import matplotlib
Traceback (most recent call last):
  File "<stdin>", line 1, in <module>
ModuleNotFoundError: No module named 'matplotlib'
>>>
- If you find the matplotlib module is not installed, you can run the command
pip install matplotlibto install it first.$ pip show matplotlib WARNING: Package(s) not found: matplotlib $ pip install matplotlib Collecting matplotlib Downloading matplotlib-3.3.4-cp37-cp37m-macosx_10_9_x86_64.whl (8.5 MB) |████████████████████████████████| 8.5 MB 207 kB/s Collecting pillow>=6.2.0 Downloading Pillow-8.1.0-cp37-cp37m-macosx_10_10_x86_64.whl (2.2 MB) |████████████████████████████████| 2.2 MB 98 kB/s Collecting cycler>=0.10 Downloading cycler-0.10.0-py2.py3-none-any.whl (6.5 kB) Collecting pyparsing!=2.0.4,!=2.1.2,!=2.1.6,>=2.0.3 Downloading pyparsing-2.4.7-py2.py3-none-any.whl (67 kB) |████████████████████████████████| 67 kB 258 kB/s Collecting kiwisolver>=1.0.1 Downloading kiwisolver-1.3.1-cp37-cp37m-macosx_10_9_x86_64.whl (61 kB) |████████████████████████████████| 61 kB 225 kB/s Collecting python-dateutil>=2.1 Downloading python_dateutil-2.8.1-py2.py3-none-any.whl (227 kB) |████████████████████████████████| 227 kB 161 kB/s Collecting numpy>=1.15 Downloading numpy-1.20.1-cp37-cp37m-macosx_10_9_x86_64.whl (16.0 MB) |████████████████████████████████| 16.0 MB 327 kB/s Requirement already satisfied: six in /Library/Frameworks/Python.framework/Versions/3.7/lib/python3.7/site-packages (from cycler>=0.10->matplotlib) (1.15.0) Installing collected packages: python-dateutil, pyparsing, pillow, numpy, kiwisolver, cycler, matplotlib Successfully installed cycler-0.10.0 kiwisolver-1.3.1 matplotlib-3.3.4 numpy-1.20.1 pillow-8.1.0 pyparsing-2.4.7 python-dateutil-2.8.1 # Display the python matplotlib module installed path. $ pip show matplotlib Name: matplotlib Version: 3.3.4 Summary: Python plotting package Home-page: https://matplotlib.org Author: John D. Hunter, Michael Droettboom Author-email: [email protected] License: PSF Location: /Library/Frameworks/Python.framework/Versions/3.7/lib/python3.7/site-packages Requires: cycler, numpy, pillow, pyparsing, python-dateutil, kiwisolver Required-by:
2. Use matplotlib Draw Point Steps.
- First, you should import matplotlib.pyplot module as below.
import matplotlib.pyplot as plt
- Then you can invoke pyplot.scatter method to draw a point or multiple points.
plt.scatter(3, 9, s=1000)
- You can also invoke the pyplot module’s other methods to draw x or y-axis labels, and tick marks also.
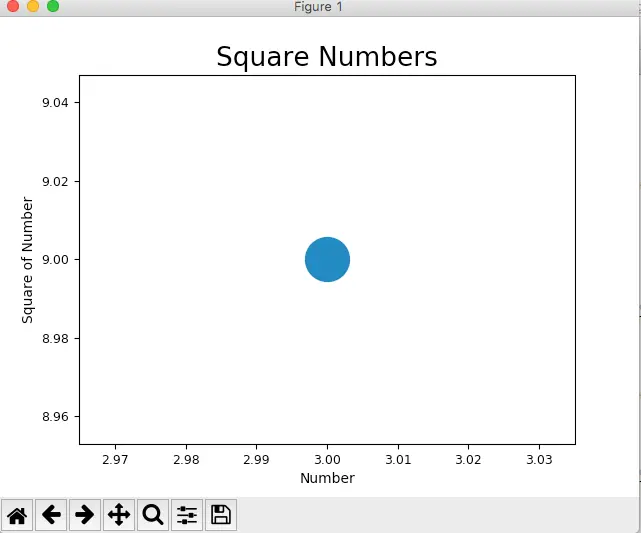
2.1 Draw Single Point.
- Run below example code in eclipse PyDev.
''' @author: zhaosong ''' # Import pyplot module and alias it as plt. This can avoid repeatly call pyplot. import matplotlib.pyplot as plt # Draw a point based on the x, y axis value. def draw_point(): # Draw a point at the location (3, 9) with size 1000 plt.scatter(3, 9, s=1000) # Set chart title. plt.title("Square Numbers", fontsize=19) # Set x axis label. plt.xlabel("Number", fontsize=10) # Set y axis label. plt.ylabel("Square of Number", fontsize=10) # Set size of tick labels. plt.tick_params(axis='both', which='major', labelsize=9) # Display the plot in the matplotlib's viewer. plt.show() if __name__ == '__main__': draw_point() - There will popup matplotlib‘s viewer that displays the below picture.
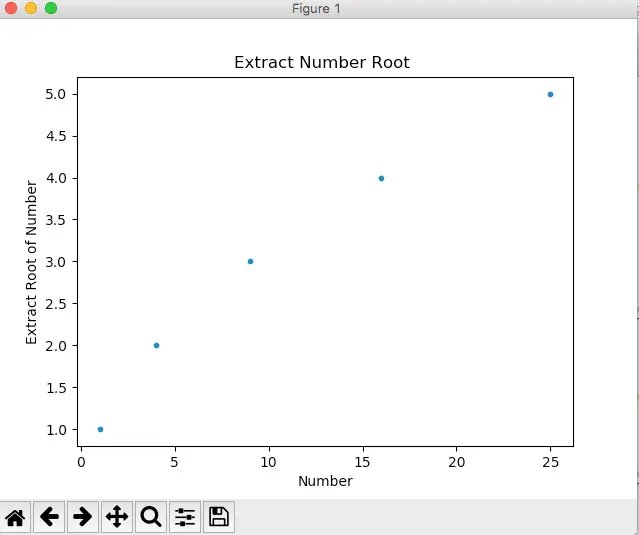
2.2 Draw Multiple Points.
- Below is the python source code.
import matplotlib.pyplot as plt # Draw multiple points. def draw_multiple_points(): # x axis value list. x_number_list = [1, 4, 9, 16, 25] # y axis value list. y_number_list = [1, 2, 3, 4, 5] # Draw point based on above x, y axis values. plt.scatter(x_number_list, y_number_list, s=10) # Set chart title. plt.title("Extract Number Root ") # Set x, y label text. plt.xlabel("Number") plt.ylabel("Extract Root of Number") plt.show() if __name__ == '__main__': draw_multiple_points() - Below is the figure.
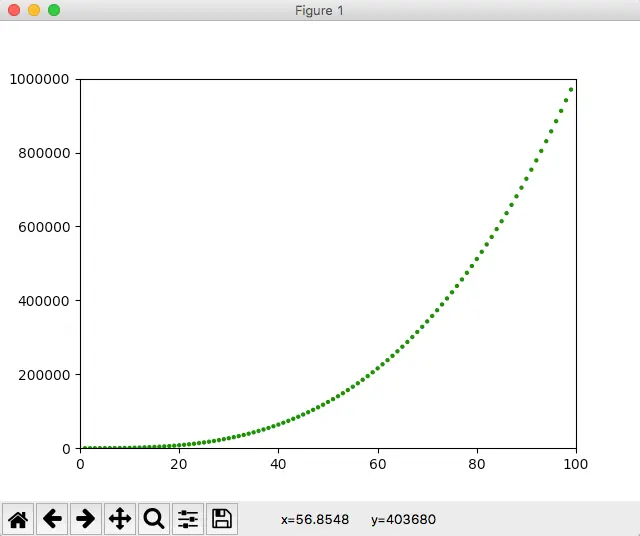
2.3 Draw Range Function Auto Generate Points.
- This example draws multiple points using green color, and each point’s x and y axis is calculated with the python range function automatically.
- Below is the python source code.
import matplotlib.pyplot as plt

# Draw a serial of points which x, y axis value is calculated by range function.
def draw_point_with_auto_generate_values():

    # Set the x axis number max value.
    x_number_max = 100

    # Auto generate x number value list by range function.
    x_number_list = list(range(1, x_number_max))

    # Y axis value is assigned by x**3
    y_number_list = [x**3 for x in x_number_list]

    # Draw points based on above x, y value list and remove the point black outline. And the point color is green.
    plt.scatter(x_number_list, y_number_list, s=10, edgecolors='none', c='green')

    # Set x, y axis min and max number.
    plt.axis([0, x_number_max, 0, x_number_max**3])

    plt.show()

if __name__ == '__main__':
    draw_point_with_auto_generate_values()
- Below is the popup figure.
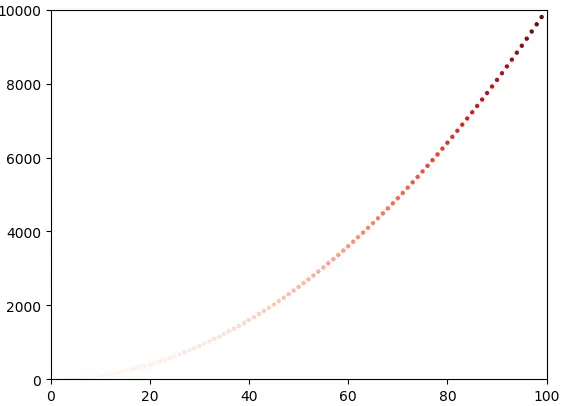
2.4 Save Matplotlib Graphic As Image Programmatically.
- If you click the disk button in the Matplotlib viewer, you can save the graphic into an image.
- But you can also save it as an image programmatically. You just need to call the function matplotlib.pyplot.savefig, below is the example code.
# Import pyplot module and alias it as plt. This can avoid repeatly call pyplot. import matplotlib.pyplot as plt ''' matplotlib.pyplot.cm has been removed, so we should use matplotlib.cm instead. ''' import matplotlib.cm as cm # Draw color point with color map and save result to a picture. def save_colorful_point_to_picture(): x_number_max = 100 x_number_list = list(range(1, x_number_max)) y_number_list = [x**2 for x in x_number_list] # Draw points which remove the point black outline. And the point color is changed with color map. plt.scatter(x_number_list, y_number_list, s=10, edgecolors='none', c=y_number_list, cmap=plt.cm.Reds) # Set x, y axis minimum and maximum number. plt.axis([0, x_number_max, 0, x_number_max**2]) #plt.show() # Save the plot result into a picture this time. plt.savefig('test_plot.png', bbox_inches='tight') if __name__ == '__main__': save_colorful_point_to_picture() - After running the above code, you can find the test_plot.png file in the current python execution path.
3. Use matplotlib Draw Line
3.1 Matplotlib Draw Vertical Line.
- The matplotlib.pyplot.axvline(x=0, ymin=0, ymax=1, **kwargs) method is used to draw vertical lines.
- The first parameter is the x-axis value, it can be any value you provide, and the default x value is 0.
- The ymin is the minimum value of the y-axis, it is a percentage value, it’s value should be between 0 ( the bottom of the y-axis ) and 1 ( the top of the y-axis ).
- The ymax is the maximum value of the y-axis, its value should between 0 and 1 also.
- Below source code use the matplotlib.pyplot.axvline(x=0, ymin=0, ymax=1, **kwargs) method to draw a plot.
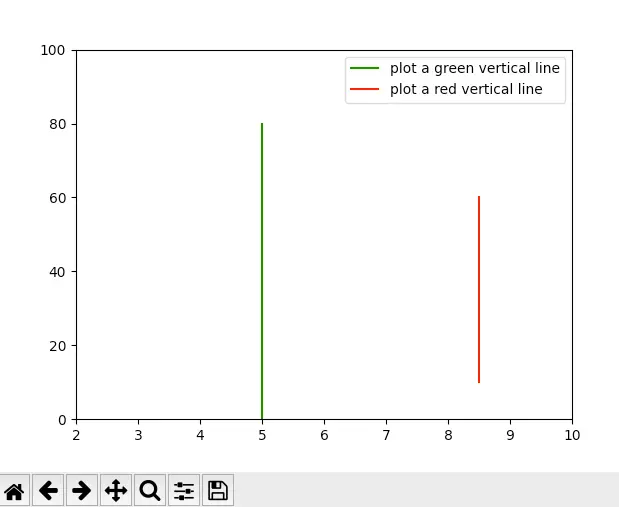
# Import pyplot module and alias it as plt. This can avoid repeatly call pyplot. import matplotlib.pyplot as plt def draw_vertical_line(): # The x-axis maximum number. axis_x = 10 # The y-axis maximum number. axis_y = 10**2 # Set x-axis and y-axis minimum and maximum number. plt.axis([2, axis_x, 0, axis_y]) # plot a green vertical line, the start point is (5, 0), the end point is (5, 0.8*axis_y). plt.axvline(5, 0, 0.8, color='green', label='plot a green vertical line') # plot a red vertical line, the start point is (8.5, 0.1*axis_y), the end point is (8.5, 0.6*axis_y). plt.axvline(8.5, 0.1, 0.6, color='red', label='plot a red vertical line') # Add the label provided in the above axvline() method plt.legend() plt.show() - Below is the resulting plot.
3.2 Matplotlib Draw Columnbar Line.
- Below is the source code.
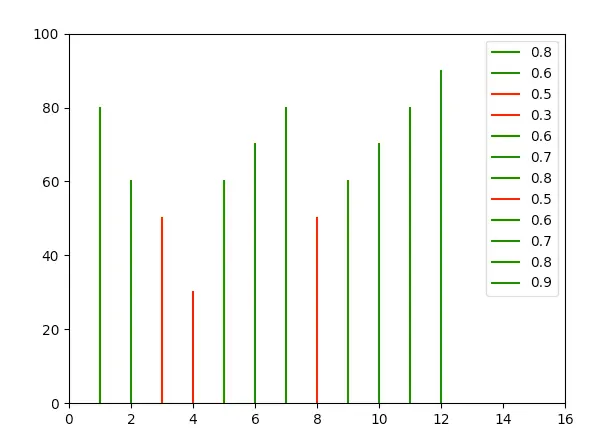
import matplotlib.pyplot as plt def draw_vertical_columnbar_line(): # The x-axis maximum number. axis_x = 16 # The y-axis maximum number. axis_y = 10**2 # Set x-axis and y-axis minimum and maximum number. plt.axis([0, axis_x, 0, axis_y]) x_value = 1 x_delta = 1 y_tuple = (0.8, 0.6, 0.5, 0.3, 0.6, 0.7, 0.8, 0.5, 0.6, 0.7, 0.8, 0.9) for y_percent in y_tuple: color_value = 'green' if y_percent < 0.6: color_value = 'red' plt.axvline(x=x_value, ymin=0, ymax=y_percent, color=color_value, label=y_percent) x_value = x_value + x_delta # Add legend label. plt.legend() plt.show() - Below is the resulting picture.
3.3 Matplotlib Draw Columnbar Line Use the stem Method.
- Below is the source code.
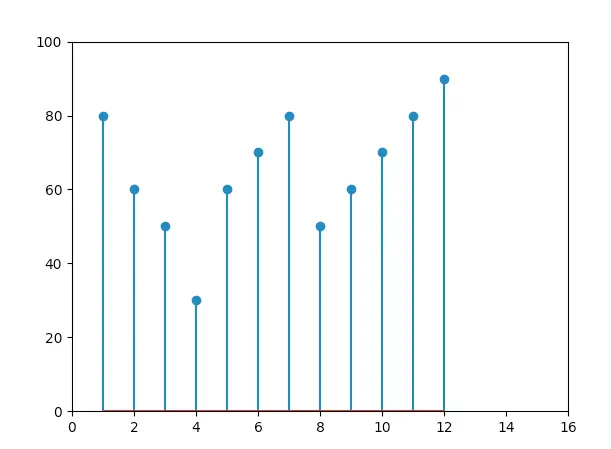
import matplotlib.pyplot as plt def draw_vertical_columnbar_line_with_stem_method(): # The x-axis maximum number. axis_x_max = 16 axis_y_max = 100 x_value = [1,2,3,4,5,6,7,8,9,10,11,12] y_value = [80, 60, 50, 30, 60, 70, 80, 50, 60, 70, 80, 90] plt.xlim(0, axis_x_max) plt.ylim(0, axis_y_max) plt.stem(x_value, y_value) plt.show() - Below is the resulting picture.
3.4 Matplotlib Draw Horizontal Line.
- Below is the source code.
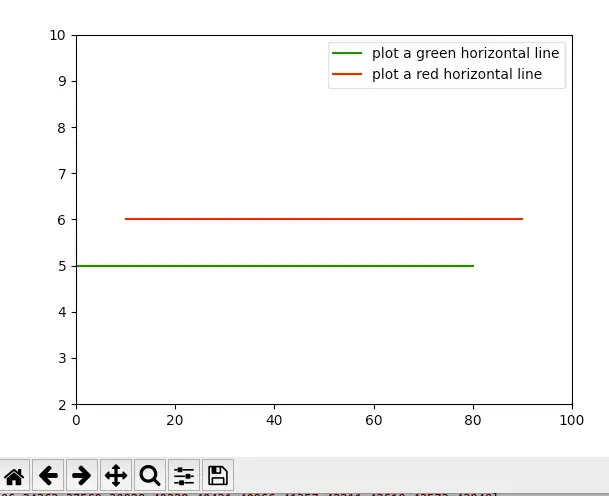
# Import pyplot module and alias it as plt. This can avoid repeatly call pyplot. import matplotlib.pyplot as plt def draw_horizontal_line(): # The x-axis maximum number. axis_x = 100 # The y-axis maximum number. axis_y = 10 # Set x-axis and y-axis minimum and maximum number. plt.axis([0, axis_x, 2, axis_y]) # plot a green horizontal line, the start point is (0,5), the end point is (0.8*axis_x, 5). plt.axhline(5, 0, 0.8, color='green', label='plot a green horizontal line') # plot a red horizontal line, the start point is (0.1*axis_x,6), the end point is (0.9*axis_x, 6). plt.axhline(6, 0.1, 0.9, color='red', label='plot a red horizontal line') # Add the label provided in the above axvline() method plt.legend() plt.show() - Below is the resulting picture.
3.5 Matplotlib Draw Line Between Multiple Points.
- The function matplotlib.pyplot.plot can be used to draw lines between points, the below example will draw a line by connecting multiple points.
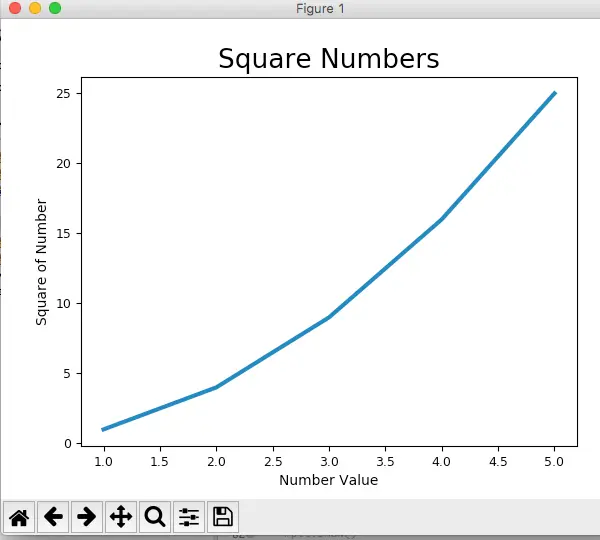
import matplotlib.pyplot as plt # Plot a line based on the x and y axis value list. def draw_line(): # List to hold x values. x_number_values = [1, 2, 3, 4, 5] # List to hold y values. y_number_values = [1, 4, 9, 16, 25] # Plot the number in the list and set the line thickness. plt.plot(x_number_values, y_number_values, linewidth=3) # Set the line chart title and the text font size. plt.title("Square Numbers", fontsize=19) # Set x axis label. plt.xlabel("Number Value", fontsize=10) # Set y axis label. plt.ylabel("Square of Number", fontsize=10) # Set the x, y axis tick marks text size. plt.tick_params(axis='both', labelsize=9) # Display the plot in the matplotlib's viewer. plt.show() if __name__ == '__main__': draw_line() - Below is the resulting figure.
4. How To Draw Extended Line Between 2 Given Points Using Matplotlib.
4.1 Question(2022/05/18).
- I am a newbie to python and matplotlib, I want to draw an arbitrary line between 2 given points.
- I find the matplotlib.pyplot.axhline method can draw a horizontal line and the matplotlib.pyplot.axvline method can draw a vertical line.
- And the above method drawn lines are extended to the edge of the graph without limit.
- I also find the plt.plot method can draw a line between 2 given points, but that is just a line segment, which does not meet my needs.
- What I want is to draw a line that goes through the 2 given points and extends to the graph limit, how can I do that? Thanks.
4.2 Answer1.
- If you use matplotlib 3.3, you can draw an infinitely long straight line without graph limit using the method matplotlib.pyplot.axline((x1,y1), (x2,y2)). This is just like the method matplotlib.pyplot.axhline and matplotlib.pyplot.axvline.