Matplotlib is a powerful and versatile Python library for creating static, animated, and interactive visualizations in a wide array of formats. Developed by John D. Hunter in 2003, Matplotlib has become a go-to tool for data scientists, analysts, and researchers to convey complex information in a visually appealing and understandable manner. In this article, we’ll explore the fundamentals of Matplotlib and delve into practical examples to demonstrate its capabilities.
1. Understanding Matplotlib.
- Matplotlib provides a flexible and intuitive interface for creating a variety of plots and charts.
- It is built on the NumPy library, allowing seamless integration with numerical data.
- The library is highly customizable, enabling users to fine-tune every aspect of a plot, from colors and labels to axis scales and annotations.
2. Installation.
- Before diving into Matplotlib, ensure you have it installed. You can install it using the following command:
pip install matplotlib
- You can read the article to learn more detailed introduction.
3. Basic Plotting.
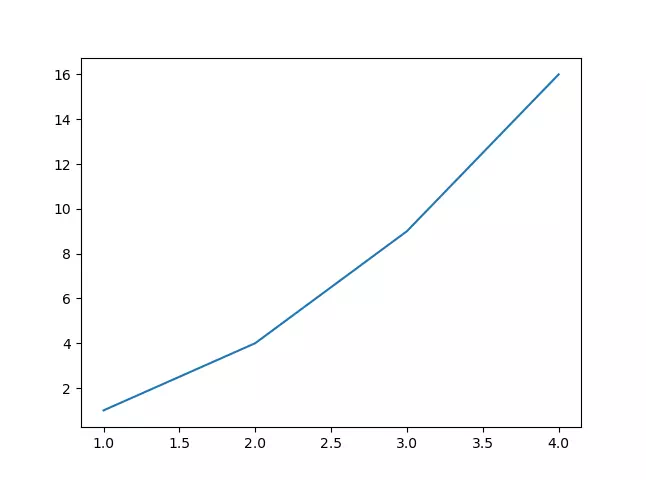
- Let’s start with a simple example of creating a basic line plot. Consider the following code snippet:
import matplotlib.pyplot as plt

# Sample data
x = [1, 2, 3, 4, 5]
y = [2, 4, 6, 8, 10]

# Create a line plot
plt.plot(x, y)

# Show the plot
plt.show()
- This code defines two lists, `x` and `y`, representing coordinates on the x and y axes. The `plt.plot()` function generates a line plot based on this data, and `plt.show()` displays the plot.
4. Customizing Plots.
- Matplotlib allows extensive customization to enhance the visual appeal of plots.
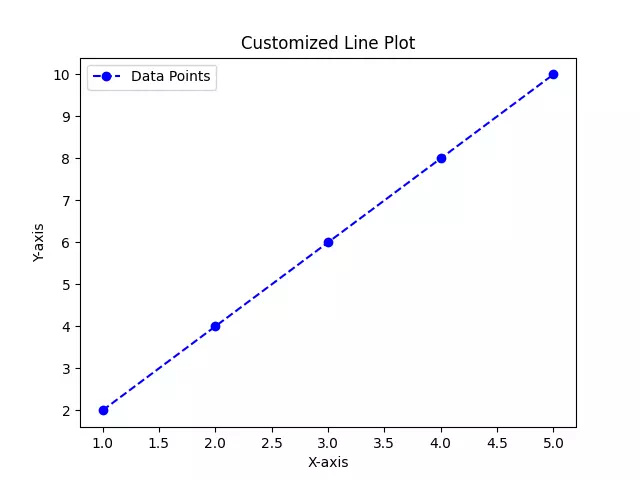
- For instance, you can add labels to axes, a title to the plot, and customize line styles and colors:
import matplotlib.pyplot as plt def custom_plot(): # Sample data x = [1, 2, 3, 4, 5] y = [2, 4, 6, 8, 10] # Create a line plot with customization plt.plot(x, y, marker='o', linestyle='--', color='b', label='Data Points') plt.title('Customized Line Plot') plt.xlabel('X-axis') plt.ylabel('Y-axis') plt.legend() # Show the plot plt.show() if __name__ == "__main__": custom_plot() - In this example, we’ve added markers to data points, changed the line style to dashed, set the line color to blue, and included labels for the axes and a legend.
5. Multiple Subplots.
- Matplotlib enables the creation of multiple subplots within a single figure.
- This is particularly useful when visualizing different aspects of the data side by side.
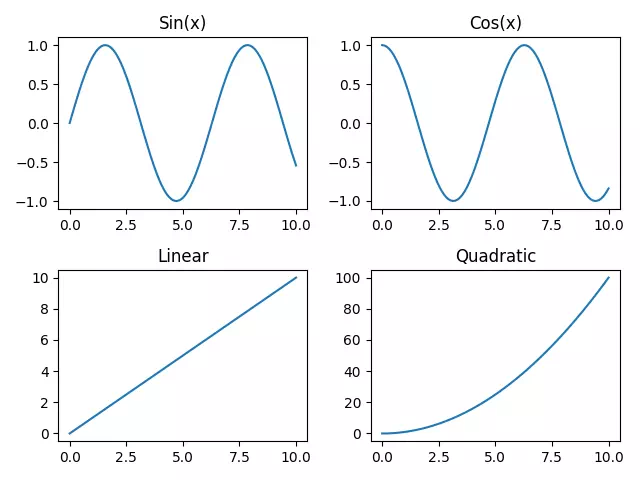
- The following example demonstrates a 2×2 subplot layout:
import matplotlib.pyplot as plt import numpy as np def multiple_plots(): # Sample data x = np.linspace(0, 10, 100) y1 = np.sin(x) y2 = np.cos(x) y3 = x y4 = x**2 # Create a 2x2 subplot layout plt.subplot(2, 2, 1) plt.plot(x, y1) plt.title('Sin(x)') plt.subplot(2, 2, 2) plt.plot(x, y2) plt.title('Cos(x)') plt.subplot(2, 2, 3) plt.plot(x, y3) plt.title('Linear') plt.subplot(2, 2, 4) plt.plot(x, y4) plt.title('Quadratic') # Adjust layout for better spacing plt.tight_layout() # Show the plot plt.show() if __name__ == "__main__": multiple_plots() - This code snippet creates four subplots, each showcasing different functions of `x`. The `plt.subplot()` function is used to specify the position of each subplot within the layout.
- Output.
6. Conclusion.
- Matplotlib is a powerful tool for data visualization in Python, offering a wide range of plotting options and customization possibilities.
- In this article, we covered the basics of creating line plots, customizing visualizations, and creating multiple subplots.
- As you explore Matplotlib further, you’ll discover its rich ecosystem of functions for creating bar plots, scatter plots, histograms, and more.
- Whether you’re a beginner or an experienced data scientist, Matplotlib is an essential library for conveying insights through compelling visualizations.
