Python IDLE (Integrated Development and Learning Environment) is a simple and lightweight integrated development environment that comes bundled with Python. It’s useful for writing, running, and debugging Python code, especially for beginners. Here’s how you can use Python IDLE to run and debug your Python code.
1. How To Use Python IDLE To Write, Run, Debug Python Source Code Steps.
1.1 Open IDLE.
On Windows: You can usually find IDLE in the Start Menu under the Python folder or search IDLE in the Windows search text box.
On macOS: Open the Terminal and type the command idle or search for “IDLE” in Spotlight.
On Linux: Open a terminal and run the command idle. If it shows the below error, then you need to first run the command sudo apt install idle to install it.
$ idle
Command 'idle' not found, but can be installed with:
sudo apt install idle
1.2 Creating a New File.
Click on “File” in the top menu and select “New File” to open a new editor window.
1.3 Write Python Code.
Now you can write your Python source code in the opened editor. For example, you can write the python code print(“hello python world.”) in it.
1.4 Run Python Code.
Once your code is written, you can run it in the following way.
Pressing `F5` or choosing “Run Module” from the “Run” menu. It will pop up a dialog to let you save the python file before run it.
Click the OK button to save the python code in the editor to a python file such as hello.py. Then it will run the python code in the python file and open a new IDLE shell window to show the output in it.
1.5 Debug Python Code.
1.5.1 Enable IDLE Debug Control.
Before you can debug python code using IDLE, you need to first enable IDLE debug control.
Click the Debug —> Debugger menu item in the IDLE Shell window ( not the python file code editor window ), then it will pop up the Debug Control window. Do not close the Debug Control window.
1.5.2 Set Breakpoint In IDLE Editor Window.
IDLE provides basic debugging capabilities. You can set breakpoints and step through your python source code.
To set a breakpoint, right click on the line number where you want to pause the execution in the IDLE python file editor window. Then click the Set Breakpoint menu item in the popup menu list.
If you want to remove the breakpoint, you can click the Clear Breakpoint menu item in the popup menu list.
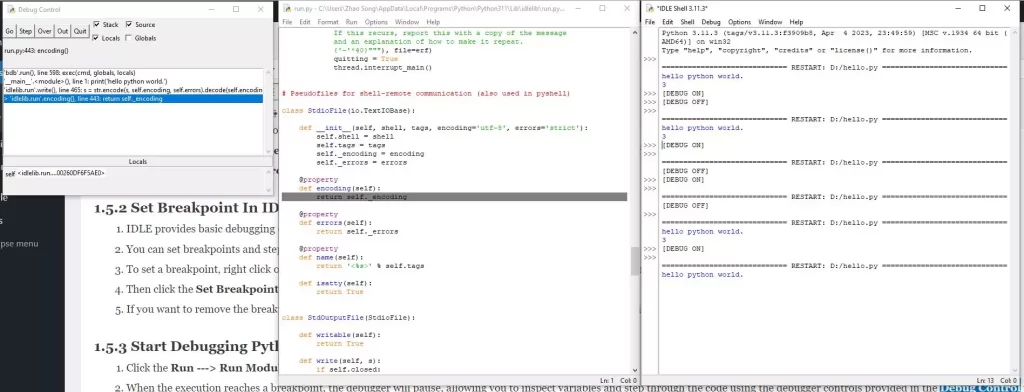
1.5.3 Start Debugging Python Code In IDLE.
Click the Run —> Run Module menu item in the IDLE python code editor window. When the execution reaches a breakpoint, the debugger will pause, allowing you to debug and step through the code using the debugger controls provided in the Debug Control window.
You can click the Go button to go to the next breakpoint. Click the Step button to step into the current function. Click the Over button to step over the current function. Click the Out button to step out the current function. Click the Quit button to quit the debugger session.
You can align the IDLE Debug Control window, Editor window, and Shell window horizontally to make it easy to manage.
1.6 View Output.
The output of your program will be displayed in the Python Shell window, which is separate from the editor.
1.7 Close IDLE.
Close the IDLE application when you’re done working by clicking the “X” button in the top-right corner of the IDLE window.
2. Conclusion.
Please note that while Python IDLE is a great tool for beginners, it has its limitations and might not provide as advanced debugging features as some other IDEs.
If you find yourself working on larger projects or needing more advanced debugging capabilities, you might consider using a more feature-rich IDE like Visual Studio Code, PyCharm, or Jupyter Notebook, which offer more extensive debugging tools and features.