In this article, I will tell you how to use the activity monitor on macOS to monitor and manage the processes running on the computer. It explains the various tabs and features of the app, including the CPU, Memory, Energy, Disk, Network, and GPU tabs. It also provides tips on how to identify and troubleshoot processes that are causing performance issues or draining the system’s resources. The article concludes with a reminder to be cautious when terminating processes and to only do so if necessary. Overall, the article provides a helpful guide for Mac users on how to effectively use the Activity Monitor app to manage their computer’s processes.
1. What Is macOS Process?
- The macOS Process refers to a program or task that is being executed on a computer running the macOS operating system.
- It is a running instance of an application, script, or system process that is assigned a unique identifier known as a Process ID (PID).
- The macOS operating system manages these processes to ensure that they operate efficiently and do not interfere with other processes or the overall system performance.
- Users can monitor and manage processes using various built-in macOS tools such as Activity Monitor or Terminal commands.
2. What Is macOS Activity Monitor?
- Activity Monitor is a built-in system utility in macOS that allows users to monitor and manage the processes and system resources of their computer in real time.
- It provides detailed information about CPU usage, memory utilization, energy usage, disk activity, network activity, and other system statistics.
- Activity Monitor also allows users to view and terminate processes that are consuming excessive system resources or causing performance issues.
- This tool is commonly used by macOS users to troubleshoot system problems, identify resource-intensive processes, and optimize system performance.
3. Why It Is Useful For Managing Processes On macOS Using Activity Monitor?
- Activity Monitor is useful for managing processes on macOS for several reasons.
- Real-time Monitoring: Activity Monitor provides real-time information about the resource utilization of running processes, allowing users to quickly identify resource-intensive tasks and take appropriate action.
- Process Management: Activity Monitor allows users to view and manage the processes running on their Macs. Users can view detailed information about each process, such as its name, PID, CPU usage, memory usage, and other statistics. They can also terminate processes that are misbehaving or causing system problems.
- Resource Optimization: Activity Monitor allows users to optimize system resources by identifying and terminating processes that are consuming excessive resources, such as CPU or memory. This can help to improve system performance and prevent crashes or freezes.
- Troubleshooting: Activity Monitor is a useful tool for troubleshooting system problems on macOS. It allows users to identify processes that may be causing performance issues or system errors, and take appropriate action to resolve them.
- Overall, Activity Monitor is a powerful utility that provides important insights into the inner workings of macOS and allows users to manage and optimize system resources effectively.
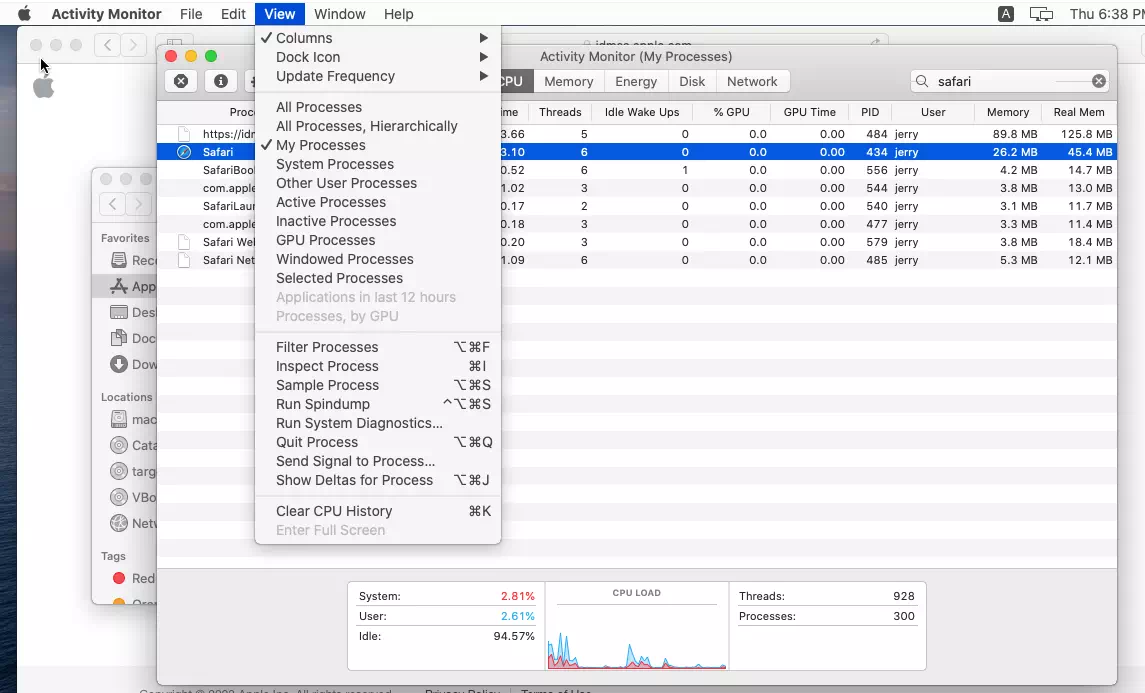
4. How To Use Activity Monitor In macOS?
- To use Activity Monitor in macOS, follow these steps.
- Open the Finder and go to the “Applications” folder.
- Open the “Utilities” folder and select “Activity Monitor“.
- Once Activity Monitor opens, you will see a list of all the processes that are currently running on your Mac.
- You can use the search bar in the upper right corner to search for a specific process by name.
- To view more information about a process, click on it to select it, and then click the “i” button ( Inspect selected process ) in the toolbar at the top left of the window.
- To force quit a process, select it from the list and click the “X” button in the toolbar.
- Activity Monitor also includes a number of tabs at the top of the window, allowing you to view different types of information such as CPU, Memory, Energy, and Disk usage, as well as Network activity.
- You can customize the display of Activity Monitor by selecting the “View” menu in the menu bar and choosing “Columns“.
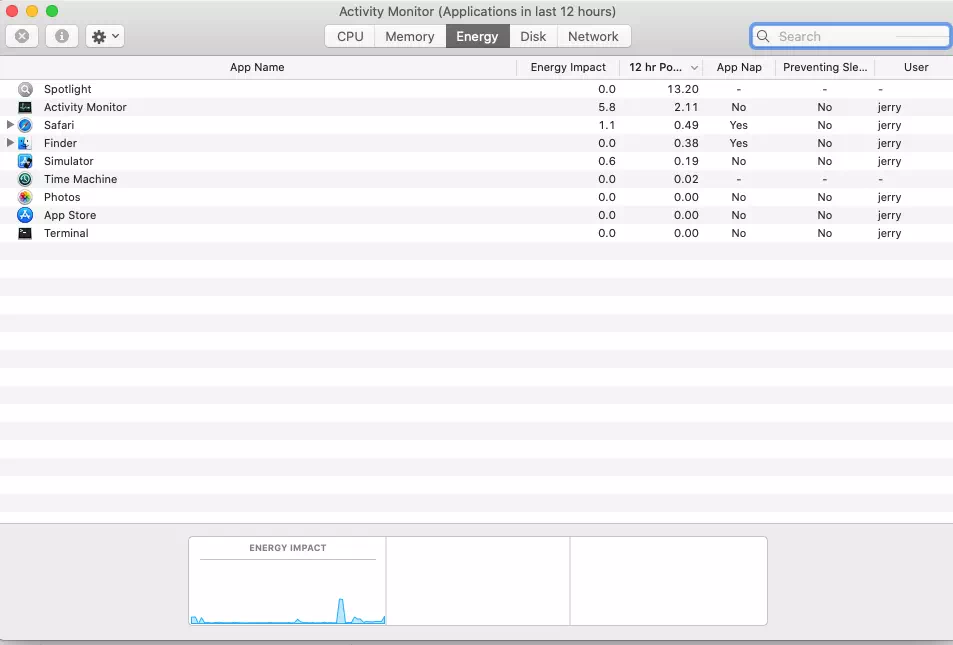
5. What Does the Activity Monitor Energy Tab Do?
- The Energy tab in Activity Monitor on macOS provides information about the energy usage of running processes and how they are impacting the battery life of your Mac.
- It displays the current energy impact of each process, measured in a unit called “Energy Impact,” which is a combination of CPU usage, Disk access, and Network activity.
- The tab also shows the average energy impact of each process over time.
- The Energy tab also displays which processes are using significant energy and may be draining your Mac’s battery faster.
- It also shows which processes are using App Nap, a feature that reduces the energy usage of background processes, and which processes are preventing your Mac from going to sleep.
- Using the information provided by the Energy tab, users can identify processes that are consuming excessive energy and take appropriate action to optimize their Mac’s battery life.
- For example, they may choose to quit energy-intensive processes or configure their Mac’s power settings to optimize battery performance.
6. How To Get CPU Usage, CPU History, and GPU History Using Activity Manager.
- To get CPU usage, CPU history, and GPU history using Activity Monitor in macOS, follow these steps.
- Open Activity Monitor from the Applications —> Utilities folder.
- To view the CPU usage, click on the “Window” menu and select “CPU Usage“.
- To view the CPU history, click on the “Window” menu and select “CPU History“.
- The CPU History window will show you a graph of the CPU usage for the past 24 hours.
- To view the GPU history, click on the “Window” menu and select “GPU History“.
- The GPU History window will show you a graph of the GPU usage for the past 24 hours.