Eclipse is the most popular programming IDE. It can be used to develop java applications as well as JavaScript applications. In this article, we will introduce how to use Eclipse to create/debug the Node.js application.
1. Create JavaScript Project.
- Install JDK and Eclipse IDE on your Windows PC. If you do not know how to do it, please read the article Beginner’s Guide For Install JDK(Java Development Kit) And Eclipse In Windows.
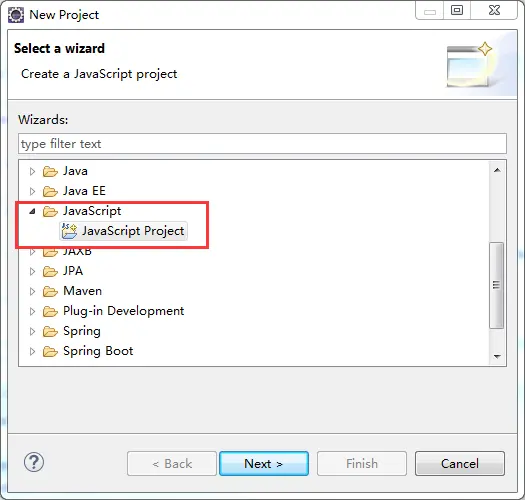
- If you use Eclipse Neon version 3, then click File —> New —> Project menu. Choose JavaScript Project in New Project popup dialog.
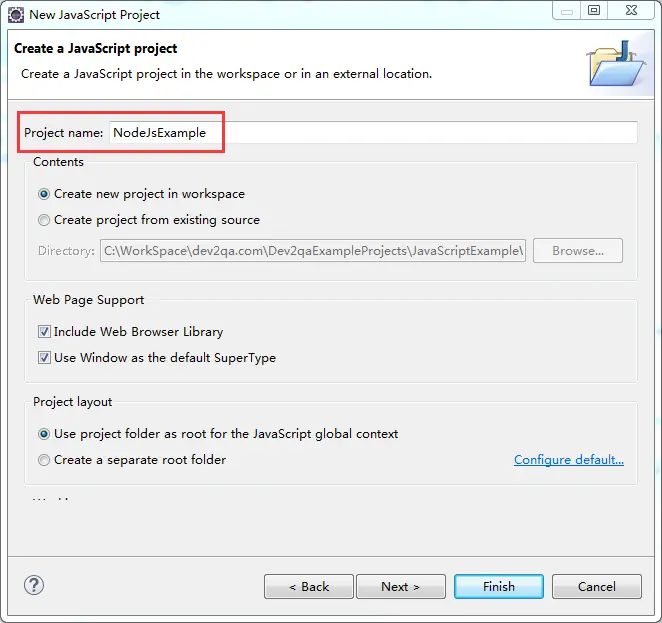
- Click the Next button, input project name, and select workspace, click the Finish button to create the JavaScript project successfully.
2. Create JavaScript File.
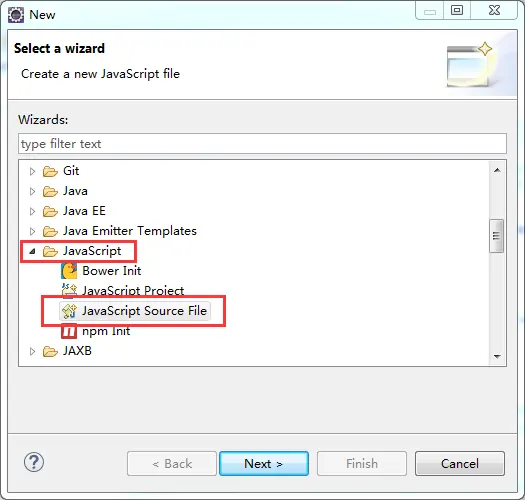
- Right-click JavaScript project name in left project explorer panel. Click New —> Other… menu. In the pop-up dialog, choose JavaScript —> JavaScript Source File as below. Click the Next button to continue.
- Select saved folder and input JavaScript file name in next dialog then click Finish button.
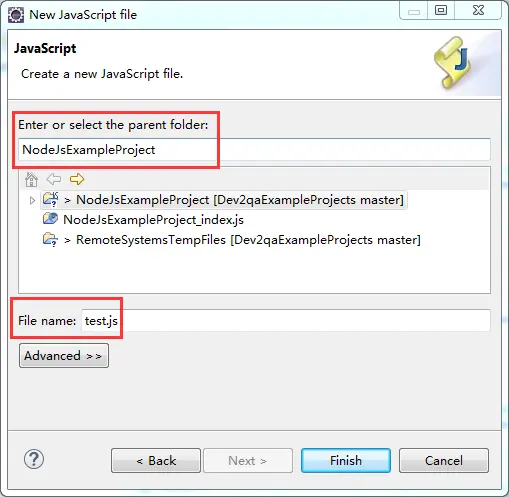
- Now you can see test.js in the left project explorer.
3. Setup Debug Runtime Configuration.
Before you can debug your JavaScript file, you must first create a debug configuration follow the below steps.
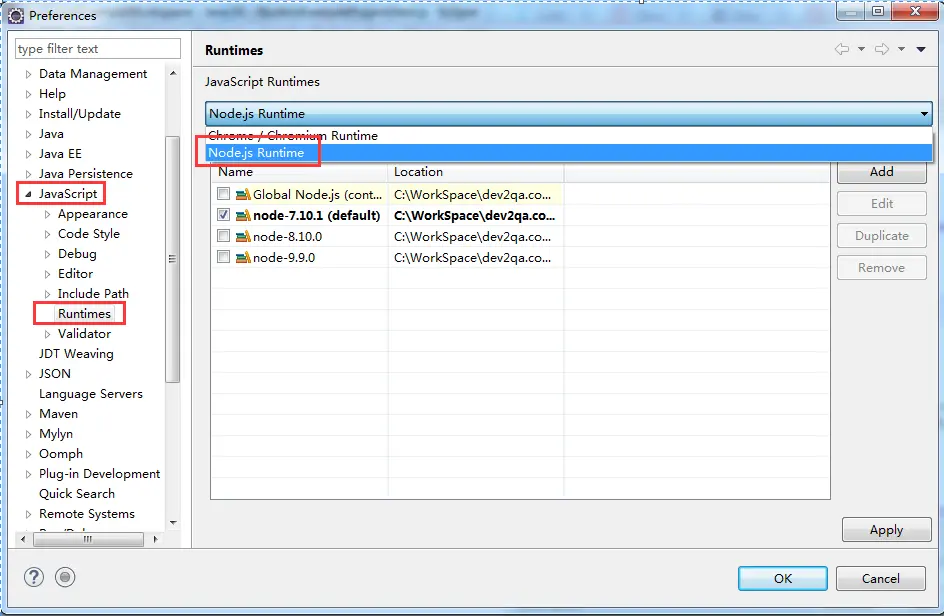
- Click Eclipse toolbar Window —> Preferences menu.
- Click JavaScript —> Runtimes menu in left panel. Choose Node.js Runtime in the right JavaScript Runtimes dropdown list. If you do not have an existing node runtime installation, you can click Add button to add one.
- Click Add button to add Node.js runtime environment. This needs you first install node.js on your PC. You can read the article How To Install Node JS In Windows to learn more. I recommend you install node.js windows binary edition which is unzipped from a zip file.
- In the Add JavaScript Runtime Install dialog, select node.exe from your install directory to the location input box ( if you run the eclipse in macOS or Linux you can run the command which node to get the node binary file installed directory path( it is usually /usr/local/bin/node on macOS and Linux ), and the command node -v can return the installed node version.), give it a name in the second input box, input node start arguments in the third input box if you have.
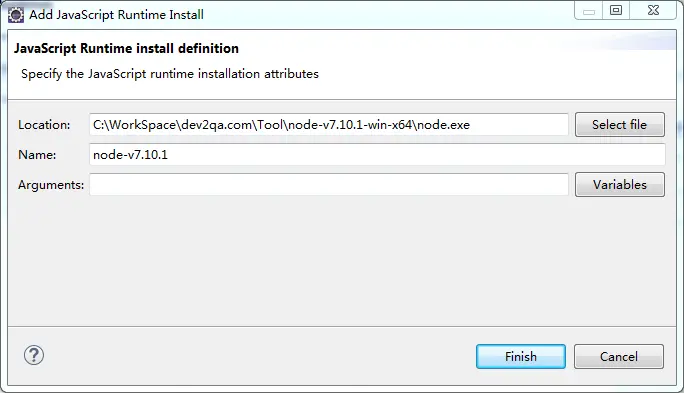
- Click the Finish button, it will return back to the Runtimes list page. Check the checkbox before the JavaScript runtime that you want to use and click Apply and Close button.
- I recommend you use node version 7.10.1 because it is a more stable version, if you use version 8 or 9 when you start debugging, it may through the below error message.
(node:10012) [DEP0062] DeprecationWarning: `node –debug` and `node –debug-brk` are invalid. Please use `node –inspect` or `node –inspect-brk` instead.Failed to connect to Standalone V8 VM
4. Debug JavaScript File.
- Write some JavaScript code in the test.js file. Double click the first column of each code line to set a breakpoint.
- Right-click the js file in the left panel, choose Debug As —> Debug Configurations menu. It will popup a dialog that lets you configure debug parameters.
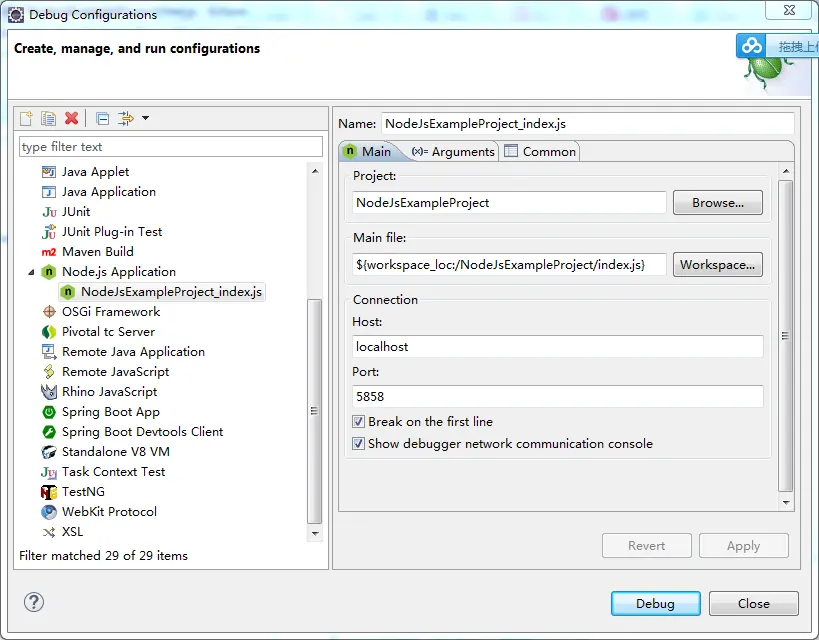
- After change debug parameters or just use the default value, click Debug button at the dialog bottom. Click the Yes button in Confirm Perspective Switch dialog then the code execution will stop at the first line of the JavaScript file. Then you can click step into ( means run into the current function ), step over ( execute over the current function without going into it ), step out ( go out of the current JavaScript function if you run into it just now) debug menus in Eclipse top toolbar to debug your JavaScript file.
5. Notes.
I just test the above procedure with Eclipse Neon.3 Release ( 4.6.3 ) and node version 7.10.1. These two components are stable to use.
If you use Node.js version 8 or 9, then you may encounter debug start failed error with the below error message.
(node:10012) [DEP0062] DeprecationWarning: `node --debug` and `node --debug-brk` are invalid. Please use `node --inspect` or `node --inspect-brk` instead.

Failed to connect to Standalone V8 VM
To fix this error, you can refer to the comments https://www.dev2qa.com/how-to-run-debug-node-js-application-with-eclipse/#comment-95159
My running node.js version is version 8. I use visual studio NTVS to debug a node.js project and got the error as this article discussed (node:10012) [DEP0062] DeprecationWarning:
node --debugandnode --debug-brkare invalid. Please usenode --inspectornode --inspect-brkinstead. Failed to connect to Standalone V8 VM.I can see from the error message that visual studio needs me to use node –inspect to replace the node –debug option to debug the node js project. But I do not know how to do it. Can anybody give me some help? Thanks.
This is because since Node.js version 7.7, the node –debug and node –debug-brk option has been deprecated. Visual studio wants to support debugging all Node.js version, so it use a combination options which contains both –inspect and –debug-brk instead.
To fix this issue, you can try the below steps.
Change “protocol”: “legacy”, to “protocol”: “auto”, in the launch.json file.
You can also add the –inspect-brk in package.json file like below.
scripts: {"debug": "DEBUG=pd* nodemon --inspect-brk --harmony --nolazy server.js"
}
Now visual studio code will change the default debug settings to below.
{"type": "node",
"request": "attach",
"name": "Attach",
"port": 9229
}
@DRinaldin.
Kindly explain step by step how to do that.
Thanks
I encountered the error stated above. ((node:12884) [DEP0062] DeprecationWarning: `node –debug` and `node –debug-brk` are invalid. Please use `node –inspect` or `node –inspect-brk` instead.
Failed to connect to Standalone V8 VM).
Is anyone able to help me rectify this error? I have been stuck on this for a few days. Kindly assist.
Thank you.
Same issue ,
Can someone help
If you use Node.js version 8 or 9, then you may encounter debug start failed error
But I need to debug with v.9. Is there any possible ?
You can try IntelliJ WebStorm.