When you use eclipse to develop a web application and deploy it into a remote tomcat server, how to debug the remote deployed web application to fix bugs? This article will tell you how to do it. This example will use Spring Tool Suite ( based on eclipse ) and tomcat server version 9.
1. Start Tomcat In Remote Debug Mode.
First, you need to start the tomcat server in JPDA mode, this mode can make the tomcat server remotely connected from an eclipse project. Below are the steps.
- CD into TOMCAT_HOME/bin folder in a terminal window.
- Run
suto change to root user in Linux or macOS. - Run
ps -ef|grep tomcatto see whether the tomcat server is running or not. - If tomcat is running, run
shutdown.shto stop it. - Run
catalina.sh jpda runcommand to start the tomcat server in debug mode. - When you see the output in the terminal window like the below message, it means the tomcat server has been started in debug mode successfully, it listens on port 8000.
Listening for transport dt_socket at address: 8000
.................................
Server startup in *** ms
2. Debug Java Web Application From Eclipse Remotely.
After deploying your java web application in the tomcat server, you can now debug the code from eclipse remotely.
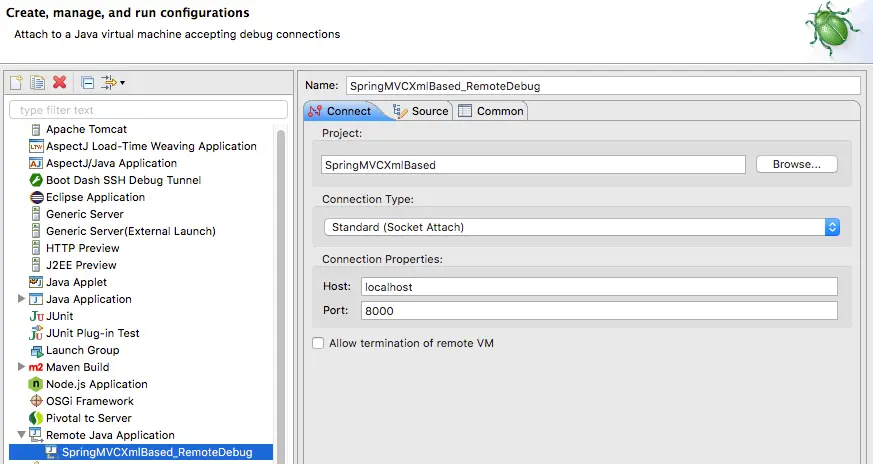
- Click Run —> Debug Configurations… menu item in the eclipse top menu bar to open the Create, manage, and run configurations dialog window.
- Select the Remote Java Application item in the left panel. It will show the text Attach to a Java virtual machine accepting debug connections under the dialog title.
- Then click the add icon(
 ) on the left panel top left corner to add a new configuration.
 - Input the configuration name in the Name input textbox ( SpringMVCXmlBased_RemoteDebug in this example ).
- Browse to select the current java project in the Project text box.
- Select Standard ( Socket Attach ) from the Connection Type: drop-down list.
- Input correct Connection Properties: Host ( the remote tomcat server IP address, in this example it is localhost because the tomcat server running on the same machine with the eclipse ) and Port ( the remote tomcat server listening port number, in this example it is 8000 ).
- Then click Apply button to save the settings. Click Debug button to begin to debug project code with the web application deployed in the remote tomcat server. You can set breakpoints in your project source code, when the application runs into the breakpoint, the execution will be paused, then you can watch the values of the variables that you want.