Random walk means to walk follow a path in a random direction with a random distance from the start point. It is a mathematics concept. Use the python matplotlib module, you can implement random walks easily. This article will tell you how to implement a random walk graph in python.
1. Python Matplotlib Random Walk Example
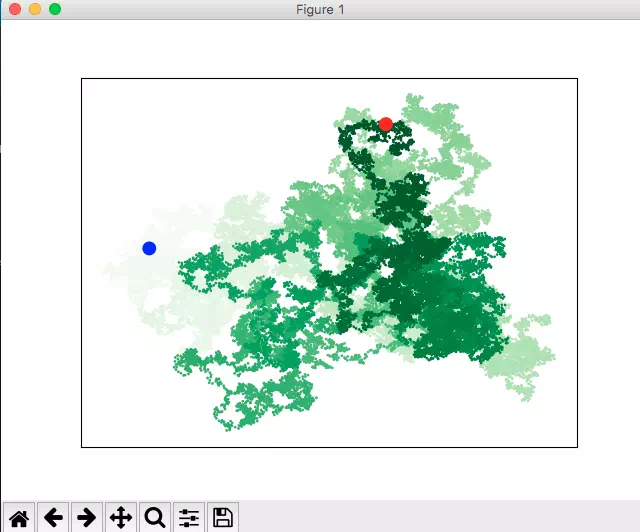
- Below is this random walk example-generated picture. The blue point is the start point, the red point is the endpoint.
- Below is the example source code, save the source code in a python file then execute it.
'''
@author: zhaosong
'''

import matplotlib.pyplot
import random

# Generate two random point steps based on the random direction and distance.
def generate_steps(distance_truple=[1,2,3,4,5,6,7,8,9,10]):

    # Get random direction.
    direction = random.choice([-1,1])

    # Get random distance.
    distance = random.choice(distance_truple)

    step = direction*distance
    return step


# Generate all random point x, y value numbers.
def generate_random_walk_list(max_point_numbers):

    # Must give a initialize value 0, otherwise the code will throw index out of range error in the while loop.
    x_numbers = [0]
    y_numbers = [0]

    # get x value list size.
    x_numbers_size = len(x_numbers)

    # Loop to create max_point_numbers point coordinate.
    while(x_numbers_size < max_point_numbers):
        x_step = generate_steps()
        y_step = generate_steps()

        # If the new point location is same with original, then calculate next point location.
        if(x_step==0 and y_step==0):
            continue

        # Calculate the next x and y by adding new step
        next_x = x_numbers[-1] + x_step
        next_y = y_numbers[-1] + y_step

        # Append new x, y value at the list end.
        x_numbers.append(next_x)
        y_numbers.append(next_y)

        # Recalculate the number list size.
        x_numbers_size = len(x_numbers)

    # Save the generated x, y value number list in a dictionary to return.
    ret = {}
    ret['x_numbers'] = x_numbers
    ret['y_numbers'] = y_numbers

    return ret

# Draw a random walk graph. Each point represent a random position that the walk pass.
def draw_randmon_walk(max_point_numbers):

    # Get all random walk points with x, y axis values list.
    random_walk_dict = generate_random_walk_list(max_point_numbers)
    x_numbers = random_walk_dict['x_numbers']
    y_numbers = random_walk_dict['y_numbers']

    # Get point color list.
    point_color = list(range(max_point_numbers))

    # Plot all the point with x, y value based on green colormap.
    matplotlib.pyplot.scatter(x_numbers, y_numbers, s=1, c=point_color, cmap=matplotlib.pyplot.cm.Greens)

    # Plot the start point as blue.
    matplotlib.pyplot.scatter(0, 0, c='blue', edgecolors='none', s=100)

    # Plot the end point as red.
    matplotlib.pyplot.scatter(x_numbers[-1], y_numbers[-1], c='red', edgecolors='none', s=100)

    # Remove all x, y axes.
    matplotlib.pyplot.axes().get_xaxis().set_visible(False)
    matplotlib.pyplot.axes().get_yaxis().set_visible(False)

    # Display the graph.
    matplotlib.pyplot.show()

if __name__ == '__main__':
    # Plot 50000 random points graph.
    draw_randmon_walk(50000)
Reference