The context object of the Html5 canvas provides 2 methods moveTo(x, y) and lineTo(x, y). The moveTo(x, y) method will move the start point to the provided coordinates. The lineTo(x, y) method will draw a line from the current point to another point that is located by the provided (x, y) coordinate. This article will show you how to use them with examples.
1. Draw Lines In Html5 Example.
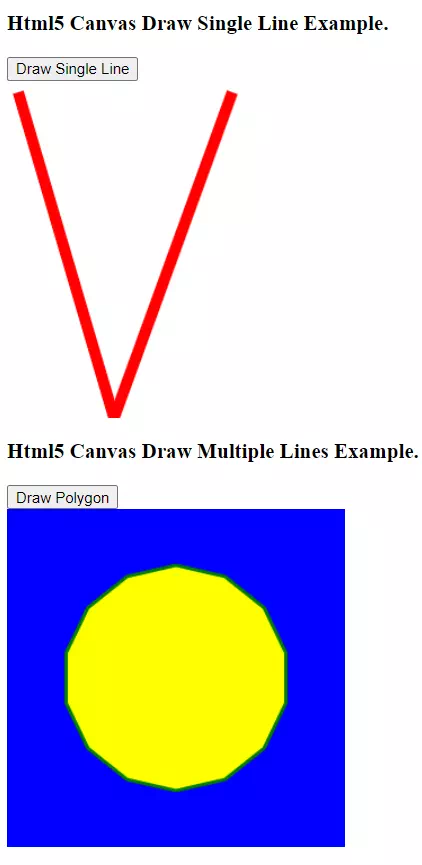
- There are 2 buttons in this example.
- When you click the first button, it will draw 2 single lines to build a red V character.
- When you click the second button, it will draw a multiple lines polygon.
- Below is the example Html web page picture.
- There are 2 source files in this example, html5-canvas-draw-lines.html, html5-canvas-draw-lines.js.
- html5-canvas-draw-lines.html.
<!DOCTYPE html> <html> <head> <meta charset="ISO-8859-1"> <title>Html5 Canvas Draw Lines Example</title> <script type="text/javascript" src="html5-canvas-draw-lines.js" charset="utf-8"></script> <style> canvas{ display:none; } </style> </head> <body> <h3>Html5 Canvas Draw Single Line Example.</h3> <div> <input type="button" id="draw-single-line" value="Draw Single Line" onclick="drawSingleLine('single-line-canvas', this)" /> <canvas id="single-line-canvas"></canvas> </div> <h3>Html5 Canvas Draw Multiple Lines Example.</h3> <div> <input type="button" id="draw-polygon" value="Draw Polygon" onclick="drawPolygon('polygon-canvas', this)" /> <canvas id="polygon-canvas"></canvas> </div> </body> </html> - html5-canvas-draw-lines.js.
/**
 *
This function will draw a red V with 2 single lines.
 */
function drawSingleLine(id, src){

    // Get the html canvas object.
    var canvas = document.getElementById(id);

    if(canvas==null){

        alert("Can not find the html element with element id " + id);

        return false;

    }

    // Set the canvas width, height, and display style values.
    canvas.width = 300;
    canvas.height = 300;
    // Show the canvas object.
    canvas.style.display = 'block';

    // Get the canvas context object.
    var ctx = canvas.getContext('2d');

    // Set the line color to red.
    ctx.strokeStyle = "red";

    // Set the line width.
    ctx.lineWidth = 10;

    // Begin draw path.
    ctx.beginPath();

    // Move to the point (10, 10).
    ctx.moveTo(10, 10);

    // Draw the first line to point(95, 300).
    ctx.lineTo(95, 300);

    // Draw the second line to point(200, 10).
    ctx.lineTo(200, 10);

    // Draw the above 2 single line.
    ctx.stroke();

    // Close the draw path.
    ctx.closePath();

}


/*
This function shows how to draw lines in html5.
 */
function drawPolygon(id, src){

    // Get the html canvas object.
    var canvas = document.getElementById(id);

    if(canvas==null){

        alert("Can not find the html element with element id " + id);

        return false;

    }

    // Set the canvas width, height, and display style values.
    canvas.width = 300;
    canvas.height = 300;
    // Show the canvas object.
    canvas.style.display = 'block';

    // Get the canvas context object.
    var ctx = canvas.getContext('2d');

    // Set the canvas fill color.
    ctx.fillStyle = "blue";
    // Fill the rectangle with the above color to the canvas.
    ctx.fillRect(0, 0, canvas.width, canvas.height);

    // Set the canvas fill color.
    ctx.fillStyle = 'yellow';
    // Set the border line color.
    ctx.strokeStyle = 'green';
    // Set the line width.
    ctx.lineWidth = 3;

    // Set the base x, y value.
    var baseX = 150;
    var baseY = 150;

    // Set the enlarge factor number.
    var s = 100;

    var dig = Math.PI * 15 / 7;

    // Begin the draw a path.
    ctx.beginPath();

    // Draw 30 lines to create the polygon image.
    for(var i = 0; i<30;i++){

        // Calculate the x, y values.
        var x = Math.sin(i * dig);
        var y = Math.cos(i * dig);

        // Draw the line to the target point.
        ctx.lineTo(baseX + x*s, baseY + y*s);
    }

    // Close the draw path.
    ctx.closePath();

    // Fill the polygon area with the yellow color.
    ctx.fill();

    // Draw the polygon area border.
    ctx.stroke();
}