After you create a swift project in Xcode and write some swift source code, you must want to debug your iOS app to help you to find out and fix errors that exist in your app. Debug and find error messages in Xcode is very easy, this article will tell you how to do it.
1. How To Set BreakPoint In Xcode.
- Open your Xcode project, then edit your swift source code file ViewController.swift by clicking it.
- If you want to add a breakpoint, just click the beginning of the source code line. When you see there is a blue arrow at the beginning of the swift source code line, this means the breakpoint has been added.
- You can right-click the breakpoint to popup a breakpoint manager menu list, the menu list contains the below menus ( Edit Breakpoint…, Disable Breakpoint, Delete Breakpoint, Revel in Breakpoint Navigator ), you can do a lot of operations ( such as edit, disable, delete and reveal ) to this breakpoint by these menu items.
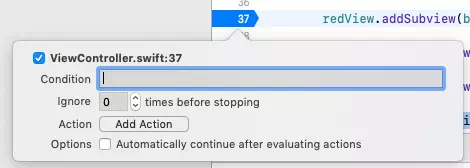
- When you click the Edit Breakpoint… menu item, it will pop up another dialog which will let you set breakpoint condition ( the breakpoint take effect only when this condition is matched ) or add breakpoint action ( the action can be a shell command, etc. ).
- When you click the Disable Breakpoint menu item in the popup breakpoint manager menu list, the breakpoint will be disabled, and the source code execution will not stop at the breakpoint, and the breakpoint arrow’s color changes to light blue also.
- When you click the Delete Breakpoint menu item in the popup breakpoint manager menu list, the breakpoint will be removed.
2. How To Start Debug Source Code In Xcode.
- Just click the triangle Build and then run the current schema button at Xcode top left (
 ) to start the iOS app as normal.
 - When the code execution runs to the breakpoint, it will stop there, and then you can debug the swift source code such as watch variable values, etc.
3. How To Find Out iOS App Execution Error Messages In Xcode.
If you find your iOS app does not act as you want, maybe there are some exceptions that have been thrown. But you should get the exception message to analyze the error reason. You can find the error messages follow the below steps.
- Click View —> Debug Area —> Activate Console menu item to show the activate console window at the bottom right of the Xcode editor debug area. All the log, warning, and error message text will be printed in this console window.
- If you can not see the activate console window, you can click the View —> Debug Area —> Show Debug Area sub-menu item in the above menu list to display the Debug Area first, then click View —> Debug Area —> Activate Console menu item to display the active console at debug area right side.
References
Is there a follow on to this article that explains how to decipher the console messages to actually find where the problem is?
For example:
__lldb_expr_500/<EXPR>:8: Fatal error: Unexpectedly found nil while implicitly unwrapping an Optional value
2022-03-06 10:37:31.733630-0600 My App[5628:2445226] __lldb_expr_500/<EXPR>:8: Fatal error: Unexpectedly found nil while implicitly unwrapping an Optional value